GCC Profiling and Coverage
Makefile snippets for branch prediction and call-graph profiling. The results can be used for performance analysis, optimized builds, and coverage QA.
For analyzing the performance of C/C++ binaries, the GCC ecosystem offers multiple options.
Widely available and easy to use are in particular the callgrind (cf. valgrind) and GCC -fprofile-generate/-fprofile-use toolchains.
Apart from manual profile and call-graph reviews, results can also guide compiler optimization.
- Other possibly related build tools are discussed at the Makefile Recipe Collection project.
- Note that tab indentation should be ensured after copy/paste, as required by the Makefile syntax.
Callgrind Function Profiling

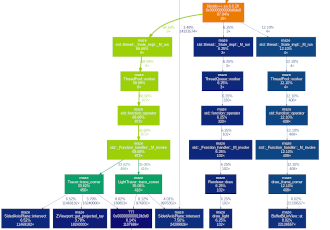
An annotated call-graph can help to quickly determine “hot” paths or bottlenecks.
With callgrind
(part of the valgrind suite), programs can be instrumented to collect function call and branching data for performance benchmarking.
After running the binary, the resulting profile can easily be transformed into a textual description or a call-graph image.
Using dot for plotting, the output format is flexible and can be for example png or svg.
Assuming $(NAME) --benchmark should be profiled and a target to build $(NAME) with CFLAGS and LFLAGS exists:
.PHONY: callgrind
callgrind: CFLAGS += -Og -g
callgrind: LFLAGS += -Og
callgrind: callgrind.txt callgrind.png
callgrind.out: $(NAME)
    valgrind --tool=callgrind --callgrind-out-file=callgrind.out \
    ./$(<) --benchmark

callgrind.txt: callgrind.out
    callgrind_annotate --inclusive=yes --show-percs=yes --tree=both $(<) > $(@)

callgrind.png: callgrind.out
    gprof2dot --format=callgrind --node-label=total-time-percentage --strip -n 0.1 -e 0.0 ${<} | \
    dot -Tpng -o ${@}

.PHONY: clean
clean:
    @rm -vf -- $(wildcard callgrind.*)
gprof GNU Profiler
As alternative to callgrind, gprof
is widely available, simple to use, and also allows call-graph or line-by-line profiling.
However, it does not support threads and is generally not recommended for evaluating performance of new projects nowadays.[citation needed]
Profile data can be created by the -pg compiler and linker flags, from which a textual call-graph is generated:
.PHONY: gprof
gprof: CFLAGS += -Og -pg -g
gprof: LFLAGS += -Og -pg
gprof: gmon.txt
gmon.out: $(NAME)
    ./$(<) --benchmark

gmon.txt: gmon.out
    gprof --brief $(NAME) $(<) > $(@)

.PHONY: clean
clean:
    @rm -vf -- $(wildcard gmon.*)
GCC Profiling and Coverage

GCC features various convenient instrumentation options for benchmarking.
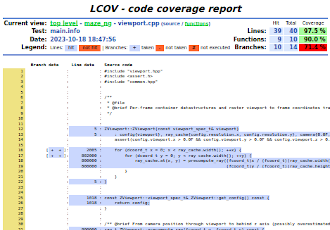
The underlying gcov, lcov, and genhtml toolchain provides branch prediction, function profiling, and line coverage reports.
Apart from readable annotated HTML output as shown, there also are parseable formats for further evaluation, e.g., in QA pipelines. In addition to performance profiling, the implicitly collected coverage can also prove useful when enabled during (unit-)testing.
Given that the $(NAME) --benchmark binary should be profiled and a target to build $(NAME) with CFLAGS and LFLAGS exists, the following will produce a corresponding report in profile/.
.PHONY: profile
profile: CFLAGS += -fprofile-generate -fprofile-arcs -ftest-coverage
profile: LFLAGS += -fprofile-generate -fprofile-arcs
profile: $(NAME).gcda $(NAME).cpp.gcov profile/index.html
$(NAME).gcda: $(NAME)
    @rm -f -- *.gcda
    ./$(<) --benchmark

$(NAME).cpp.gcov: $(NAME).gcda
    gcov --branch-probabilities --function-summaries --use-colors --use-hotness-colors --demangled-names --relative-only *.gcda >/dev/null

$(NAME).info: $(NAME).gcda
    lcov --capture --no-external --rc lcov_branch_coverage=1 --directory . --output-file $(@)

profile/index.html: $(NAME).info
    genhtml --legend --branch-coverage --function-coverage --missed --demangle-cpp --output-directory $(dir $(@)) $(<)

.PHONY: clean
clean:
    @rm -vf -- $(wildcard *.gcda) $(wildcard *.gcno) $(wildcard *.gcov) $(wildcard *.info)
    @rm -rf -- ./profile/
Optimized Profile-Builds
The generated .gcda profile files can also noticeably improve the performance of a subsequent – and correspondingly optimized – build.
Amongst others, improved branch prediction and using feedback on identified “hotspots” can be enabled by GCC’s profile optimization options.
# XXX: beneficial but not widely supported yet: -fprofile-partial-training
.PHONY: profiled
profiled: CFLAGS += -Wno-coverage-mismatch -Wno-missing-profile -fprofile-use -fprofile-correction
profiled: LFLAGS += -fprofile-use -fprofile-correction
profiled: $(NAME)