Syslog logsearch dashboard
Syslog server and built-in Web-GUI with a simple query language, statistics plotting, and alerts. Logs are maintained as JSON files, no databases are involved.
For smaller or self-hosted scenarios, stacks for log management such as Loki/Grafana, Elasticsearch ELK, or Graylog are often overkill – in especially for low volume logs, or on limited hardware such as on a Raspberry Pi. The standard setup on most distributions is still a local syslog daemon, where even the journal or container logs can be forwarded to. Relying on syslog only also allows to centrally collect logs from multiple machines very easily with no additional software required for a bit more advanced use-cases.
With syslogsearch, logs can be centrally collected by forwarding syslog messages to it.
Loglines are parsed and stored in rotating local JSON files.
A convenient built-in Web interface allows searching with a simple query language and statistics plotting support.
Also, a list of queries that is continuously evaluated can be given for alerting. An arbitrary command is triggered upon match, with the commandline being interpolated according to the record in question.
To summarize, this project aims to be the all-in-one solution for private medium-sized setups, with a single script file that contains:
- Syslog server (RFC5424 over TCP)
- Rotating file storage (per default 15 daily JSON shard files)
- Alert (watched queries that trigger arbitrary commands) and filter rulesets
- Webserver (aiohttp with basic authentication and HTTPS support)
- Responsive frontend with statistics and logtail (self-contained vanilla HTML/CSS/JS)
- Query language (simple DSL with boolean, string, and expression matches)
- Plaintext and JSON HTTP API (due to completely static frontend)
Even “longer searches” over at least “tens of thousands” log messages per day should be no problem for neither weak backend servers (Raspberry Pi) nor weak frontend devices (Mobile).
This is the successor and partial reimplementation of the now legacy Logsearch Web-GUI project that finds and parses existing plain-text log files on-demand.
Query Language and GUI
The log query language resembles other DSLs for this purpose.
In general, matches are formed by field:value pairs.
Available fields names are * for any, facility, severity, remote_host/client, hostname/host, application/app, pid, and message/msg.
Search values are (optionally quoted) strings or regular expressions in between / slash characters (case-insensitive with /i).
Multiple matches can be chained together with AND/OR.
More complex queries involving both AND/OR must be fully parenthesized.
Matches as well as sub-queries in parentheses can be negated by a NOT prefix.
With this, the query language can be kept simple and context-sensitive. For example:
*:"foo bar"NOT application:kernelapplication:kernel OR NOT facility:/daemon|kernel/(app:/^cron$/i OR hostname:localhost) AND NOT (NOT message:"init:" OR pid:1)
The full lark grammar specification can be found in the sources.
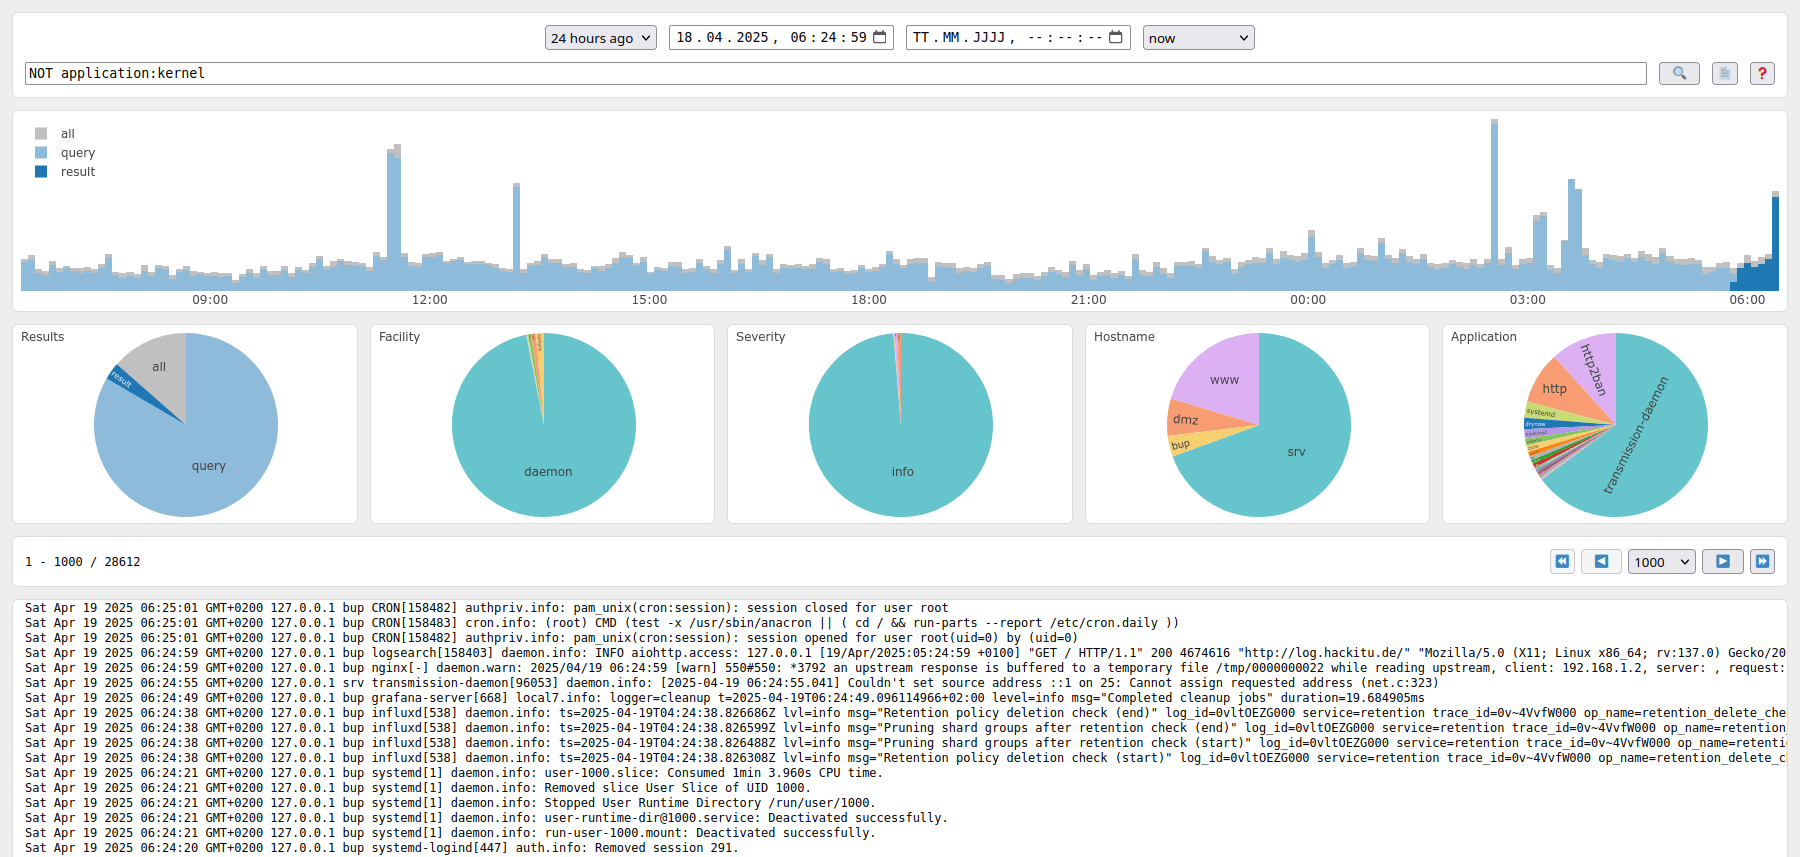
Apart from the main query input, the timeframe to consider can be restricted by two datetime pickers.
This is also the interval for the result histogram, which depicts the number of overall and matched records.
The plot can be scaled interactively or automatically and total numbers can be hidden for a per-query result view.
The pie charts below group all query results into the values of facility, severity, hostname, and application.
Only an excerpt of the actual logs is shown per default. This can be adjusted by the controls for result limiting and pagination.
The frontend is implemented with plain vanilla HTML/CSS/JS, the plotly JS library as only dependency for interactive plots comes with the corresponding local python package – so no CDN is involved. While inspecting logs on small screens is not really convenient, the GUI itself is also usable on and responsive to mobile devices.
Configuration and Usage
Syslog server, HTTP/S API server, and frontend come bundled together as a single Python script.
usage: syslogsearch.py [-h] [--verbose] [--debug] [--read-only] [--reverse]
                       [--syslog-bind-all] [--syslog-port PORT] [--http-bind-all] [--http-port PORT]
                       [--http-basic-auth] [--https-certfile PEM] [--https-keyfile PEM]
                       [--data-dir DIR] [--flush-interval SEC] [--max-buffered LEN] [--max-shards NUM]
                       [--rotate-compress] [--file-format EXT] [--json-full] [--filters TXT] [--alerts JSON]

Syslog server accepting RFC5424 compliant messages over TCP.
Records are maintained in flat JSON files.
A convenient built-in Web interface allows searching with a simple query language and statistics plotting support.

optional arguments:
  -h, --help            show this help message and exit
  --verbose             enable verbose logging (default: False)
  --debug               enable even more verbose debug logging (default: False)
  --read-only           don't actually write received records (default: False)
  --reverse             order results and pagination by most recent entry first (default: False)
  --systemd-notify      try to signal systemd readiness (default: False)

  --syslog-bind-all     bind to 0.0.0.0 instead of localhost only (default: False)
  --syslog-port PORT    syslog TCP port to listen on (default: 5140)
  --http-bind-all       bind to 0.0.0.0 instead of localhost only (default: False)
  --http-port PORT      HTTP port to listen on (default: 5141)

  --http-basic-auth     require basic authentication using credentials from LOGSEARCH_USER and LOGSEARCH_PASS environment variables (default: False)
  --https-certfile PEM  certificate for HTTPS
  --https-keyfile PEM   key file for HTTPS

  --data-dir DIR        storage directory (default: .)
  --flush-interval SEC  write out records this often (default: 60.0)
  --max-buffered LEN    record limit before early flush (default: 1000)
  --max-shards NUM      number of 'daily' files to maintain (default: 15)
  --rotate-compress     create .gz files for old shards instead of delete (default: False)
  --file-format EXT     format for new files, either 'json' or 'csv' (default: json)
  --json-full           assume full objects instead of tuples in JSON mode (default: False)

  --filters TXT         filter query definitions file
  --alerts JSON         alert definitions file
Even though there is HTTPS and authentication support, using a reverse proxy is recommended when exposing Python webserver implementations to untrusted environments in general.
Tested for Python 3.8 and 3.10. Once started, logging, storage, and frontend can be tried out by for example:
logger -t logger -p user.info --rfc5424 --server 127.0.0.1 --port 5140 --tcp -- "Hello World!"
Log Alerts and Filters
The log stream can be continuously watched for certain queries in order to trigger alert traps. Arbitrary commands are executed upon match – the configured commandline will be interpolated according to the record in question. For example, an alerts configuration file could look like:
[
  {
    "name": "Undervoltage Alert Notification",
    "query": "application:kernel AND message:/Under-?voltage detected/",
    "command": ["alert-trap.sh", "Alert: Undervoltage detected at $hostname", "$timestamp $facility $severity $application $message"],
    "limit": 0.0
  }
]
Note that using variables in the command to call (first list item) is technically supported but might impose a security risk. Trap commands are executed by a separate thread that sequentially spawns processes and are subject to being killed after a certain timeout. An optional rate-limit in seconds prevents bursts.
In order to skip certain log messages, a filter ruleset can be provided.
The file should consist of one query per line, empty lines and # prefixes are ignored.
If any expression matches, the record will be discarded right away and is not subject to further processing.
JSON Web API
As the served Web GUI frontend is completely static and self-contained, it does nothing but call its own HTTP API.
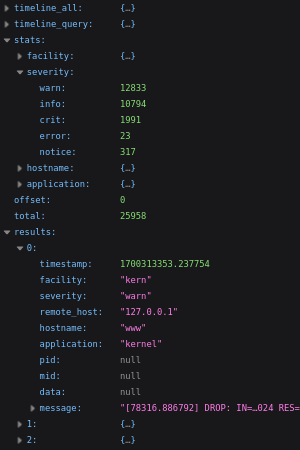
This main endpoint can also be accessed directly or via custom scripts at /api/search?q=… for performing arbitrary queries.
Corresponding search statistics and structured results are returned in a single JSON object.
Accepted GET parameters:
q=query- Search query expression string to evaluate, as supported by the Web GUI. Note that standard URL encoding rules apply.
s=starte=end- Start and end time for limiting the search window, as Unix timestamp.
o=offsetl=limit- Pagination for actually returned entries. Defaults to zero offset and no limit – everything. Note that all found matches affect the statistics, not just the currently returned window.
The same signature is provided by /api/tail for pre-formatted plaintext results.
As auxiliary endpoint, /api/flush writes buffered records to disk on next occasion. This is already done periodically and/or automatically, though.
For verifying the respective configuration, /api/alerts and /api/filters return the list of active alert rules or filters correspondingly.
File Formats
While records in API responses are always JSON objects, the storage format can be chosen independently. As repeating the keys for every line would be a huge waste, JSON tuples (i.e., lists) are used instead per default. This can be changed by the corresponding commandline flag, for example to ease external processing. Also, each line is parseable for itself as NDJSON, there is no global surrounding array.
As third option, tab-separated CSV is supported, which is slightly more compact than JSON. Although the parser can be kept very simple, JSON deserialization is usually still faster, presumably because it can be backed by “native” C code.
When enabled via rotate-compress, files that fall out of the max-shards limit are .gz compressed and then ignored, otherwise deleted.
Installation
With the provided setup.py, installation to /usr/local/bin/syslogsearch is as simple as:
sudo pip install -U --ignore-installed .
sudo pip show syslogsearch
sudo pip uninstall --yes syslogsearch
These install and uninstall commands are also wrapped by the Makefile, as well as virtual environment installation, type checking, and linting.
Lots of linux distributions come with rsyslog per default.
So when not using syslogsearch directly, all logs can centrally be forwarded by for example in /etc/rsyslogd.d/10-syslogsearch.conf:
*.* @@127.0.0.1:5140;RSYSLOG_SyslogProtocol23Format
Similarly, syslog-ng should also be able to forward RFC5424-compliant log streams.
In order to make sure that no important logs bypass a local syslog daemon,
the Docker logging driver and systemd journal forward
can become relevant.
A minimal systemd unit file /etc/systemd/system/syslogsearch.service could look like the following:
[Unit]
Description=Syslog logsearch dashboard

[Service]
User=syslog
Group=adm
Type=notify
ExecStart=/usr/local/bin/syslogsearch --systemd-notify --verbose --data-dir /var/log/syslogsearch/

[Install]
WantedBy=syslog.service
Similarly, building and running with Docker is also straight-forward:
FROM python:3.10-slim

RUN mkdir /install /var/log/syslogsearch
COPY requirements.txt setup.py syslogsearch.py /install/
RUN pip install -U /install && rm -rf /install

EXPOSE 5140
EXPOSE 5141
VOLUME /var/log/syslogsearch

ENTRYPOINT ["/usr/local/bin/syslogsearch"]
CMD ["--syslog-bind-all", "--http-bind-all", "--verbose", "--data-dir", "/var/log/syslogsearch/"]
The container image itself can (and should) run --read-only and with any non-root --user that matches the external volume permissions.

